The Coppock curve: what it is and how it works
An indicator among technical analysis tools that is known to some, but generally little discussed and used – is the Coppock Curve (CC), also known as the Coppock Method. Sometimes also called the Coppock index.
It was first introduced to the public in the early 1960s by its creator, Edwin Sedgwick Coppock, an economist by training who specialized in long-term forecasts and research.
This indicator goes a bit beyond the usual models, as its purpose – to provide analysis and operational signals over the long term. In fact, it was created to identify long-term buying opportunities for the S&P500 and Dow Jones Industrial indices. In practice, it has also been used to signal selling, including in the cryptocurrency market.
At the same time, it has also been used to signal selling, including in the cryptocurrency market.
Indicator Features
It belongs to momentum indicators and was created with the purpose of identifying market turning points, in our case – the cryptocurrency market.
This tool was based on the idea that the emotional and volatile behavior of markets can be identified by adding up the percentage changes that have occurred in the recent past.
Coppock curve formula
The structure of the formula and its calculation is quite simple and is based on three technical analysis tools you may have seen before: weighted moving average (WMA), short-term and medium-term rate of change(ROC).
The formula's structure and calculation is quite simple and is based on three technical analysis tools you may have seen before: weighted moving average (WMA), short-term and medium-term rate of change(ROC).
Elements of the formula with the values of the original periods used by Coppock:
- WMA10 = weighted moving average over 10 periods.
- ROC14 = 14-period rate of change
- ROC11 = rate of change over 11 periods
The corresponding formula can be written as follows:
Coppock's Curve = WMA10 из (ROC14 + ROC11)
As always, it is worth emphasizing that the default parameters can be changed and adapted to the tokens being analyzed.
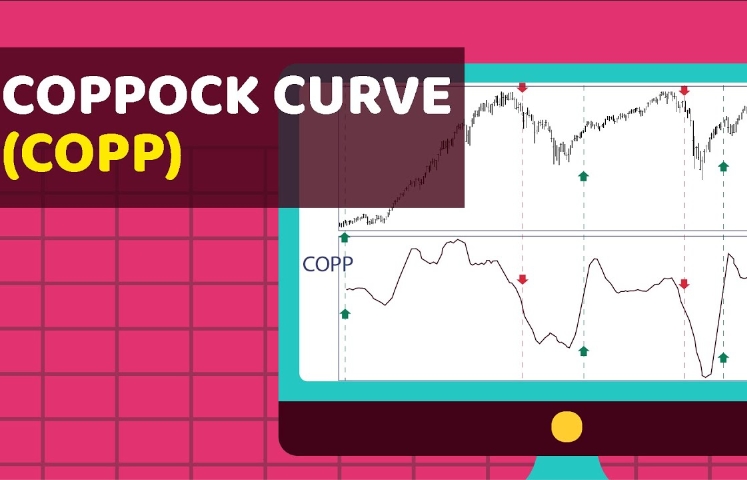
How to use the Coppock curve
The curve generates signals when it crosses the zero line. Therefore, the strategy is to buy when the curve goes above the line and sell when the curve falls below zero.
To use the curve more effectively, it should be combined with other signals – this will allow you to find the optimal tactics for trading. The result of this formula should not be the only and fundamental factor in decision making.
ЧTo leave a comment, you must sign up.


 Русский
 English